I went through all annual U.S. Geological Survey’s Mineral Commodity Summaries for gold, silver, platinum and palladium for the last 23 years.
From these reports I collected the annual world mine production for each year, and I also noted the top three producers of each metal for 1995, 2000, 2005, 2010, 2015 and 2017. The intention was to get an overview of year-on-year variability in mine output, the long term output trends and the change in leading producer nations.
The mine output of each metal, normalized in year 2000:
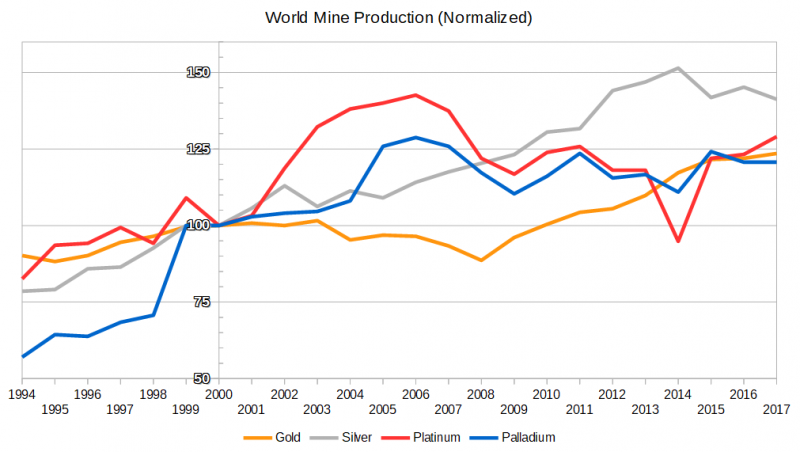
World mine output 1994-2017 (normalized)
Some observations (from year 2000 onward):
- Gold
- Max output in 2017
- Min output in 2008
- +24% since 2000 (1.3% annually)
- Largest year-over-year change; +8.4% in 2008
- Silver
- Max output in 2014
- Min output in 2000
- +41% since 2000 (2.1% annually)
- Largest yoy change; +9.4% in 2012
- Platinum
- Max output in 2006
- Min output in 2014
- +29% since 2000 (1.5% annually)
- Largest yoy change; +28.6% in 2017
- Palladium
- Max output in 2006
- Min output in 2000
- +21% since 2000 (1.1% annually)
- Largest yoy change; +16.5% in 2005
Some interesting notes:
- Platinum and palladium peaked in 2006
- Platinum dipped by 20% in 2016 and recovered the next year. A google search indicates the cause; the 2014 South Africa platinum strike
- The long-term trend is 1-2% annual increase in production but with another starting point this would look different. The only metal with a steady uptrend the last decade is gold.
Perhaps looking at top producers will uncover more:
Gold
- Gold 1995 – World 2250 tons
- South Africa – 524 tons (23%)
- USA – 320 tons (14%)
- Australia – 254 tons (11%)
- Gold 2000 – World 2550 tons
- South Africa – 431 tons (17%)
- USA – 353 tons (14%)
- Australia – 296 tons (12%)
- Gold 2005 – World 2470 tons
- South Africa – 295 tons (12%)
- Australia – 262 tons (11%)
- USA – 256 tons (10%)
- Gold 2010 – World 2560 tons
- China – 345 tons (13%)
- Australia – 261 tons (10%)
- USA – 231 tons (9%)
- Gold 2015 – World 3100 tons
- China – 450 tons (15%)
- Australia – 278 tons (9%)
- Russia – 252 tons (8%)
- Gold 2017 – World 3150 tons
- China – 440 tons (14%)
- Australia – 300 tons (10%)
- Russia – 255 tons (8%)
In 1995 South Africa was the world’s largest gold producer – with more than double that of USA on second place. SA’s output fell from 524 tons in 1995 to 295 tons 2005, and since then SA has not even made it to the top three. USA has also dropped out of the list.
China entered the top three in 2010 (directly to the first place) with an output of 345 tons. It has further grown to 440 tons in 2017.
Silver
- Silver 1995 – World 14,000 tons
- Mexico – 2200 tons (16%)
- Peru – 1600 tons (11%)
- USA – 1500 tons (11%)
- Silver 2000 – World 17,700 tons
- Mexico – 2338 tons (13%)
- Peru – 2217 tons (13%)
- USA – 1860 tons (11%)
- Silver 2005 – World 19,300 tons
- Peru – 3190 tons (17%)
- Mexico – 2890 tons (15%)
- China – 2500 tons (13%)
- Silver 2010 – World 23,100 tons
- Mexico – 4410 tons (19%)
- Peru – 3640 tons (16%)
- China – 3500 tons (15%)
- Silver 2015 – World 25,100 tons
- Mexico – 5370 tons (21%)
- Peru – 3850 tons (15%)
- China – 3100 tons (12%)
- Silver 2017 – World 25,000 tons
- Mexico – 5600 tons (22%)
- Peru – 4500 tons (18%)
- China – 2500 tons (10%)
Mexico and Peru have consistently topped the list, and have grown their dominance to 22 and 18% respectively in 2017.
China produced an impressive 3500 tons in 2010, from not even making the top three in 2000. China’s production in 2017 had dropped to 2500 tons.
Platinum
- Platinum 1995 – World 145 tons
- South Africa – 118 tons (81%)
- Russia – 18 tons (12%)
- Canada – 6 tons (4%)
- Platinum 2000 – World 155 tons
- South Africa – 114 tons (74%)
- Russia – 30 tons (19%)
- Canada – 5.5 tons (4%)
- Platinum 2005 – World 217 tons
- South Africa – 169 tons (78%)
- Russia – 30 tons (14%)
- Canada – 6.4 tons (3%)
- Platinum 2010 – World 192 tons
- South Africa – 148 tons (77%)
- Russia – 25 tons (13%)
- Zimbabwe – 8.8 tons (5%)
- Platinum 2015 – World 189 tons
- South Africa – 139 tons (74%)
- Russia – 22 tons (12%)
- Zimbabwe – 13 tons (7%)
- Platinum 2017 – World 200 tons
- South Africa – 140 tons (70%)
- Russia – 21 tons (11%)
- Zimbabwe – 15 tons (8%)
Platinum is dominated by South Africa with 70% of the world production in 2017. Its production peaked in 2005 at 169 tons, down to 140 in 2017.
Russia, the second largest producer, topped in 2010 at 30 tons. In 2017 its production was 21 tons or 11% of the world total. Zimbabwe has grown close to Russia at 15 tons.
Palladium
- Palladium 1995 – World 112 tons
- South Africa – 49 tons (44%)
- Russia – 48 tons (43%)
- Canada – 7.1 tons (6%)
- Palladium 2000 – World 174 tons
- Russia – 94 tons (54%)
- South Africa – 56 tons (32%)
- USA – 10 tons (6%)
- Palladium 2005 – World 219 tons
- Russia – 97 tons (44%)
- South Africa – 85 tons (39%)
- USA – 13 tons (6%)
- Palladium 2010 – World 202 tons
- Russia – 85 tons (42%)
- South Africa – 82 tons (41%)
- USA – 12 tons (6%)
- Palladium 2015 – World 216 tons
- South Africa – 83 tons (38%)
- Russia – 81 tons (38%)
- Canada – 21 tons (10%)
- Palladium 2017 – World 210 tons
- Russia – 81 tons (39%)
- South Africa – 78 tons (37%)
- Canada – 19 tons (9%)
Palladium is dominated by South Africa and Russia with almost 40% of the world total each. Since 2010 both countries have had a stable (or slight declining) production at around 80 tons.
My thoughts
- South Africa shows several red flags
- Both platinum and palladium peaked in 2005
- Their gold production has collapsed
- The 2014 strike caused a 20% decline in the global platinum output
- Still accounting for 70% of platinum and 37% of palladium markets, the world is at risk of a severe global shortage if SA’s mining production gets disrupted
- Mexico and Peru accounts for 40% of the silver market. Further research needed on these two countries
Categories: Uncategorized
Tags: commodities, etfs, finance, futures, precious metals, trading